ADVERTISING DISCLOSURE: THIS POST CONTAINS AFFILIATE LINKS. READ FULL DISCLAIMER
Why Real Estate Investors Use Mashvisor
Mashvisor cuts market research from weeks to hours by surfacing rental yield and occupancy data for 40+ million U.S. properties. Best for out-of-state investors comparing multiple markets or agents prospecting neighborhoods. Weak for hyperlocal analysis or international properties. Plans start at $17.99/month with a 7-day trial.
Last updated May 1, 2026.
In This Review
What Mashvisor Is
Mashvisor is a real estate investment analytics platform that aggregates property-level data, neighborhood metrics, and rental income projections into a single dashboard. The core value proposition is speed: turning months of manual market research into hours of filtered searches and automated calculations.
The platform pulls data from MLS listings, Airbnb performance data, Zillow, public records, and multiple rental listing sites. It then runs projections for both short-term rental (STR) and long-term rental (LTR) strategies on the same property, letting investors compare cash-on-cash return, cap rate, and occupancy rates side by side.
Mashvisor covers 95% of U.S. markets, from major metros like Austin and Miami to smaller markets like Boise and Raleigh. Coverage quality varies significantly by market size. Major metros have dense comp data and reliable projections. Smaller markets thin out quickly, and multiple user reports on Reddit and Trustpilot flag accuracy issues in rural or emerging areas.
Two Product Lines Under One Brand
Mashvisor offers two distinct product suites. The Find & Invest plans (Lite, Standard, Professional) are designed for property acquisition: market screening, property search, and investment analysis. The Manage plans are for active STR operators who need channel management, dynamic pricing, and guest messaging tools.
Most investors use Mashvisor during the acquisition phase, not operational management. The tools are built to help you decide which property to buy and which rental strategy to pursue. Once you own the property and start managing bookings, Mashvisor’s feature set becomes less relevant compared to dedicated STR management platforms like Hospitable or Guesty.
Mashvisor Pricing
Mashvisor runs a subscription model split into two categories: Find & Invest (for property buyers) and Manage (for STR operators). All Find & Invest plans are billed annually despite being marketed with monthly pricing, which has caused confusion and negative reviews from first-time users.
Find & Invest Plans (Acquisition Tools)
| Plan | Price | What’s Included |
|---|---|---|
| Lite | $17.99/month (billed annually at $215.88) | Traditional and Airbnb income analysis for individual properties, rental comps, basic ROI metrics (cap rate, cash-on-cash return) |
| Standard | $49.99/month (billed annually at $599.88) | Property Finder with heatmaps, neighborhood analytics, compare up to 4 properties side-by-side, export 20 searches/month to Excel, Market Finder tool |
| Professional | $74.99/month (billed annually at $899.88) | Multifamily and foreclosure filters, export 60 searches/month, PDF property reports, request custom data exports, advanced property analysis for large portfolios |
All plans include a 7-day free trial. Cancellation is allowed anytime, but there are no refunds. You retain access through the end of the paid period.
Manage Plans (STR Operations)
Mashvisor’s Manage suite starts at $11/month per property (billed annually) for basic channel management, unified inbox, and website builder. The Pro plan runs $38/month per property with dynamic pricing, task automation, and owner reporting. Enterprise pricing for 100+ properties is custom.
Most investors using Mashvisor for acquisition research do not need the Manage plans. These are separate products aimed at active STR hosts, not property buyers.
API Access for Developers
Mashvisor offers a Real Estate Data API starting at approximately $129/month. The API provides programmatic access to property data, STR analytics, LTR rent estimates, neighborhood metrics, and investment calculations. Pricing scales with usage volume (API call limits). Annual subscriptions include additional free months.
Important: Mashvisor markets monthly pricing but bills annually. A “Standard” plan at $49.99/month charges your card $599.88 upfront. This has triggered billing complaints on Trustpilot and Reddit. Always verify annual vs. monthly billing before subscribing.
Key Features
Mashvisor packages multiple research-heavy workflows into one interface. The features below are what investors use most during the property acquisition phase.
Property Finder with Color-Coded Heatmaps
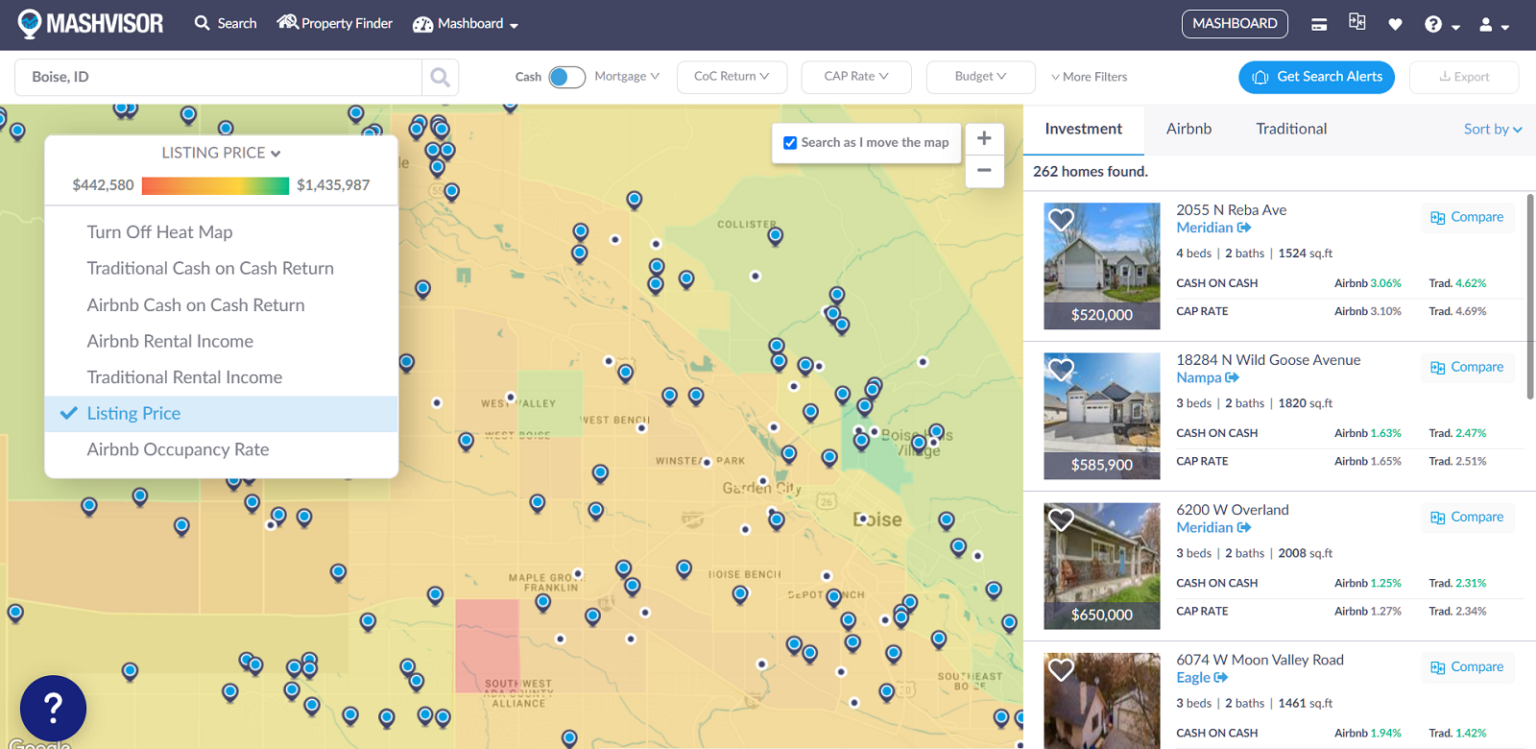
The Property Finder lets you search by location, budget, property type, and rental strategy (STR, LTR, or both). Results display on a color-coded heatmap that visualizes profitability metrics across neighborhoods.
You can toggle between data layers: cash-on-cash return, cap rate, rental income, occupancy rate, or listing price. Green zones indicate high performance, red zones indicate low performance. This makes it easy to spot promising neighborhoods at a glance without manually analyzing each zip code.
The heatmap is genuinely useful for narrowing markets before you go property-level. If you’re deciding between Dallas and Phoenix, the neighborhood overlays surface patterns faster than spreadsheet comps.
Airbnb Calculator and Rental Comps
Enter a property address and Mashvisor generates projected monthly revenue, occupancy rate, and nightly rate based on comparable Airbnb listings in the area. For traditional rentals, it shows monthly rent estimates pulled from rental listing sites and public records.
The STR vs. LTR comparison is Mashvisor’s signature feature. You get side-by-side projections for the same property rented as a short-term vacation rental or a long-term lease. This helps investors decide which strategy maximizes cash flow before committing capital.
Rental comps are available on the Standard plan and above. Mashvisor displays comparable properties with nightly rates, occupancy estimates, and annual revenue for STRs. For LTRs, it shows monthly rent estimates and vacancy rates.
Market Finder for City-Level Analysis
The Market Finder ranks entire cities and neighborhoods by investment potential. You can filter by Mashmeter score (Mashvisor’s proprietary investment rating), median property price, rental revenue, cap rate, and crime rate.
This tool is designed for investors who haven’t chosen a market yet. If you’re deciding between investing in Nashville, Scottsdale, or Tampa, the Market Finder surfaces high-level performance data to help narrow your options before you start property-level searches.
Investment Metrics Calculated Automatically
Mashvisor auto-calculates cap rate, cash-on-cash return, gross rent multiplier, and net operating income for every property. You can override default assumptions (down payment, interest rate, property management fees, vacancy rate) to model different scenarios.
This eliminates the need to build custom spreadsheets for each property. The calculations happen instantly as you adjust filters, letting you screen dozens of properties in the time it would take to manually model three.
MLS Integration and Property Data
Mashvisor integrates MLS listings so you can analyze on-market properties directly within the platform. You see asking price, property specs, and rental projections in one view instead of toggling between Zillow and your own analysis tools.
Property data includes tax assessments, ownership history, lot size, square footage, bedroom/bathroom count, and year built. This helps investors filter properties by physical characteristics before running financial models.
Dynamic Pricing Tool (STR Management Plans Only)
Mashvisor’s AI-powered dynamic pricing adjusts nightly rates based on demand trends, seasonality, local events, and booking history. This feature is exclusive to the Manage plans and is not available on Find & Invest subscriptions.
The pricing tool syncs with Airbnb and other STR platforms via API, automatically updating rates without manual calendar adjustments. It’s useful for active hosts but irrelevant for investors in the acquisition phase.
Where Mashvisor Stands Out
Mashvisor delivers genuine value in a few specific areas where competitors fall short.
Only Platform Comparing STR and LTR in One Interface
No other major platform lets you toggle between short-term rental and long-term rental projections on the same property without switching tools. AirDNA focuses exclusively on STR analytics. Zillow provides general property data but no rental strategy comparison. Mashvisor is the only tool that answers “should I Airbnb this or lease it long-term?” in one click.
This saves time and reduces the margin for error when you’re deciding between rental strategies. Instead of building two separate models in Excel, you see both projections side by side with consistent assumptions.
Heatmaps Accelerate Market Screening
The color-coded heatmap interface is genuinely faster than spreadsheet analysis for top-of-funnel market research. If you’re screening 10 neighborhoods across three cities, the visual overlays surface patterns in minutes that would take hours to extract from raw data.
This is particularly useful for out-of-state investors who lack local market knowledge. The heatmap helps you identify high-yield pockets without driving around or hiring a local scout.
MLS Integration Reduces Tool-Switching
Being able to analyze on-market properties directly within Mashvisor eliminates the back-and-forth between Zillow, Realtor.com, and your own analysis tools. You see asking price, property specs, and rental projections in one dashboard.
This workflow efficiency matters when you’re evaluating dozens of listings. Every minute spent switching tabs is a minute not spent analyzing properties.
Covers 95% of U.S. Markets
Mashvisor provides nationwide coverage across major metros and secondary markets. If you want to invest in Boise, Raleigh, or Charleston, Mashvisor has data. Competitors like AirDNA also cover these markets, but Mashvisor’s LTR data gives you dual-strategy analysis that AirDNA doesn’t.
Where Mashvisor Falls Short
Mashvisor has real limitations that surface repeatedly in user reviews on Reddit, Trustpilot, and third-party sites.
Data Accuracy Degrades in Smaller Markets
Projections in rural or emerging markets are frequently unreliable. Multiple users on Reddit’s r/realestateinvesting and r/airbnb report that occupancy rates and rental income estimates are inflated or based on thin comp data in markets outside major metros.
One BiggerPockets user in Orlando noted Mashvisor’s Airbnb occupancy rates matched the 75th percentile of actual listings, not the median. Another investor in Kissimmee flagged HOA fees that were off by more than $1,000/month compared to actual property listings.
The underlying issue is comp density. In Austin or Miami, Mashvisor pulls from thousands of active STR listings and gets accurate medians. In a smaller market like Sioux Falls or Wichita, the comp pool thins out, and estimates become less reliable.
Not Built for Active Property Management
Mashvisor is designed for the buying decision, not the operational phase. Once you own the property and start managing bookings, the platform’s feature set becomes less relevant. Dedicated STR management tools like Hospitable, Guesty, or Lodgify offer stronger channel management, guest messaging, and automation.
The Manage plans exist, but most users report buying Mashvisor for acquisition research and then switching to a dedicated STR tool for operations.
Annual Billing Despite Monthly Pricing Marketing
Mashvisor markets plans as “$49.99/month” but charges $599.88 upfront when you subscribe. This has triggered billing complaints on Trustpilot and Reddit. Users feel misled when they expect a $50 monthly charge and see a $600 annual charge instead.
The 7-day free trial doesn’t fully mitigate this because the annual billing structure isn’t always clear during signup. Multiple negative reviews cite this as a trust issue.
Customer Support Inconsistencies
Several Trustpilot and G2 reviews cite slow or unhelpful support responses, particularly for billing issues. Some users report difficulty canceling subscriptions or getting refunds even when canceling within the trial period.
Mashvisor’s refund policy is strict: no refunds after the trial period ends. If you cancel mid-year, you retain access through the paid period but don’t get prorated refunds. This is standard for annual subscriptions but frustrates users who expected monthly flexibility.
U.S.-Only Coverage (Limited International)
Mashvisor’s core Find & Invest tools cover U.S. markets only. The API offers limited international data (Great Britain, Spain, UAE), but the main platform does not. If you invest in Mexico, Portugal, or Thailand, Mashvisor won’t help.
Competitors like Airbtics and AirDNA offer stronger international coverage for STR investors operating outside the U.S.
Important: If your target market is a smaller city or rural area, cross-reference Mashvisor’s projections with at least one additional data source before making a purchase decision. No single platform has a monopoly on accuracy, and the cost of an overestimated revenue projection is measured in years of negative cash flow.
What Real Users Say
Mashvisor has mixed reviews across third-party platforms. The aggregated ratings are positive overall, but negative reviews highlight recurring issues with data accuracy and billing.
Review Scores:
- Trustpilot: 4.7/5 stars (456 reviews)
- BBB: 4.67/5 stars (281 reviews)
- G2: 4.5/5 stars (limited reviews)
- Google: 3.9/5 stars (52 reviews)
The lower Google score and the recurring themes in negative Trustpilot reviews suggest polarized user experience. Investors in major metros with dense comp data report positive outcomes. Investors in smaller markets or those hit by billing surprises report frustration.
Common praise: Users consistently highlight the time savings, intuitive heatmap interface, and the value of side-by-side STR vs. LTR comparisons. Many investors credit Mashvisor with helping them identify profitable markets they wouldn’t have considered otherwise. The visual dashboards and organized data presentation reduce decision paralysis during property screening.
Common complaints: Data accuracy issues dominate negative reviews. Users in smaller markets report inflated occupancy rates, incorrect HOA fees, and missing property listings. Billing transparency is the second most common complaint: annual billing disguised as monthly pricing creates trust issues. Customer support responsiveness varies, with some users reporting quick resolutions and others citing slow or unhelpful responses, particularly for refund requests.
Who Should Use Mashvisor
Mashvisor is best suited for specific investor profiles. It solves a narrow problem well but isn’t a fit for everyone.
- Out-of-state investors comparing multiple markets. If you’re deciding between Austin, Denver, and Charlotte, Mashvisor’s heatmaps and market rankings accelerate the screening process.
- Investors deciding between STR and LTR strategies. The side-by-side rental strategy comparison is genuinely useful. No other platform offers this in one interface.
- Real estate agents prospecting for investor clients. Agents can use Mashvisor to quickly identify high-yield properties for clients, then export data for presentations.
- First-time rental property investors learning market analysis. The structured dashboards and automated calculations help beginners understand what makes a good investment property without building custom spreadsheets.
- Investors focused on major U.S. metros. If your target markets are Austin, Miami, Phoenix, Nashville, or Dallas, Mashvisor’s data density is strong and projections are generally reliable.
Who Should Not Use Mashvisor
- Investors focused on smaller or rural markets. Data accuracy degrades significantly outside major metros. If your target market is a small town or emerging area with thin STR comp data, Mashvisor’s projections become less reliable.
- International investors. Mashvisor’s core tools cover U.S. markets only. If you invest in Mexico, Europe, or Asia, competitors like Airbtics or AirDNA offer better global coverage.
- Active STR hosts needing operational management tools. Mashvisor is built for acquisition research, not day-to-day property management. Once you own the property, dedicated tools like Hospitable or Guesty offer stronger channel management and automation.
- Investors requiring hyperlocal granularity. If you need block-by-block analysis or micro-neighborhood insights (e.g., walking distance to Rainey Street in Austin vs. three blocks away), AirDNA’s property-level granularity is stronger.
- Budget-conscious investors on monthly billing cycles. Mashvisor’s annual billing structure (despite monthly pricing marketing) is a dealbreaker for investors who prefer monthly flexibility or need to pause subscriptions mid-year.
Mashvisor vs. Alternatives
Mashvisor competes with several platforms in the real estate analytics space. Each has distinct strengths depending on your use case.
| Platform | Best For | Starting Price | Key Difference |
|---|---|---|---|
| Mashvisor | Investors comparing STR vs. LTR strategies on U.S. properties | $17.99/month (annual billing) | Only platform with side-by-side STR vs. LTR comparison in one interface |
| AirDNA | STR-focused investors needing granular comp data and seasonality trends | Varies by plan (contact for pricing) | Deeper STR analytics, property-level granularity, stronger in smaller markets with limited comps |
| Airbtics | Global STR investors needing worldwide market coverage | Varies by plan | International coverage (Europe, Asia, Latin America), stronger outside U.S. markets |
| Zillow | General property lookup and home valuation (Zestimate) | Free | No rental analytics or investment metrics, limited to property data and valuations |
| BNBCalc | Free STR revenue estimates for individual properties | Free (limited features) | Address-level STR projections at no cost, but lacks market screening and heatmap tools |
Bottom line: If you need STR vs. LTR comparison on U.S. properties, Mashvisor is the strongest option. If you need deeper STR granularity or international coverage, AirDNA or Airbtics are better fits. If you’re on a tight budget and only need quick STR estimates, BNBCalc’s free calculator is a starting point.
Quick Pick Guide
Use these decision shortcuts to determine if Mashvisor is the right fit:
- Choose Mashvisor if: You’re comparing STR vs. LTR strategies on the same property, screening multiple U.S. markets simultaneously, or need heatmap visualizations to accelerate neighborhood analysis.
- Choose AirDNA if: You’re STR-only, need hyperlocal granularity (block-by-block comps), or invest in smaller markets where Mashvisor’s data thins out.
- Choose Airbtics if: You invest internationally (Europe, Asia, Latin America) and need global STR coverage beyond the U.S.
- Skip Mashvisor if: You’re already managing active properties (not in acquisition phase), invest in rural or emerging markets with thin comp data, or require monthly billing flexibility.
Popular Integrations
Mashvisor’s integration ecosystem is split between Find & Invest tools (data sources) and Manage tools (operational integrations).
Data Sources (Find & Invest Plans)
Mashvisor aggregates data from:
- MLS (Multiple Listing Service): On-market property listings with asking price, specs, and photos
- Airbnb: STR performance data (nightly rates, occupancy, reviews)
- Zillow: Property valuations, rental estimates, and market trends
- Public records: Tax assessments, ownership history, sales history
- Rental listing sites: LTR rent estimates pulled from HotPads, RentJungle, and similar platforms
These are not user-facing integrations. Mashvisor pulls data from these sources automatically to populate its dashboards.
Operational Integrations (Manage Plans Only)
The Manage plans (for active STR operators) integrate with:
- Airbnb: Two-way sync for bookings, rates, availability, messages
- Vrbo: Two-way sync for reservations, rates, promotions
- Booking.com: Calendar sync and reservation management
- TripAdvisor: Calendar sync for managing reservations
- Stripe and PayPal: Payment processing for direct bookings (1% transaction fee on Stripe)
- iCal calendars: Connects to any channel exporting iCal for availability sync
API for Developers
Mashvisor’s Real Estate Data API provides programmatic access to property data, STR/LTR analytics, neighborhood metrics, and investment calculations. The API uses standard HTTPS and JSON formats, requiring no proprietary libraries.
Developers use the API to build custom dashboards, investment tools, PropTech apps, or real estate marketplaces. Pricing starts at approximately $129/month and scales with usage volume.
Frequently Asked Questions
Does Mashvisor offer a free trial?
Yes, all Find & Invest plans (Lite, Standard, Professional) include a 7-day free trial. After the trial, you’re charged the full annual subscription fee. Manage plans also offer a 7-day free trial.
How much does Mashvisor cost for a 10-property portfolio?
If you’re analyzing properties for acquisition, the Standard plan at $49.99/month (billed annually at $599.88) covers unlimited property searches. If you’re managing 10 active STR properties, the Manage plans start at $11/month per property, totaling $110/month for 10 properties on the Starter tier.
Is Mashvisor worth it, or should I use AirDNA?
It depends on your use case. Mashvisor is better if you’re comparing STR vs. LTR strategies or screening multiple markets for acquisition. AirDNA is better if you’re STR-only, need deeper granularity, or invest in smaller markets where Mashvisor’s data thins out. If you’re still deciding between rental strategies, Mashvisor’s dual-strategy comparison justifies the cost.
Can Mashvisor handle commercial real estate or multifamily properties?
The Professional plan includes multifamily property filters, but Mashvisor is designed primarily for residential rental properties (single-family homes, condos, townhouses). For commercial real estate (office, retail, industrial), platforms like CoStar or Reonomy are better fits.
How long does Mashvisor take to implement?
The Find & Invest tools require no implementation. Sign up, enter your target market, and start searching. The learning curve is minimal; most users navigate the heatmap and property search within the first session. The Manage plans (STR operations) require connecting your Airbnb or Vrbo accounts via API, which takes 10-15 minutes.
Is Mashvisor’s dynamic pricing good enough to replace dedicated revenue management tools?
For small-scale hosts (1-5 properties), Mashvisor’s dynamic pricing is adequate. For larger portfolios or hosts in competitive markets, dedicated tools like PriceLabs or Wheelhouse offer more sophisticated pricing algorithms and competitor tracking. Mashvisor’s pricing tool is included in the Manage plans but isn’t its core strength.
Does Mashvisor integrate with QuickBooks or accounting software?
No. Mashvisor does not integrate with QuickBooks, Xero, or other accounting platforms. The Manage plans include basic expense tracking and owner reporting, but for full accounting integration, you’ll need a separate tool or export data manually.
Is Mashvisor HIPAA, SOC 2, or GDPR compliant?
Mashvisor is not HIPAA-compliant (it’s not designed for healthcare data). For SOC 2 and GDPR compliance, contact Mashvisor’s support team directly to verify current certifications. These are not typically required for real estate investment analytics but may matter if you’re integrating Mashvisor’s API into a regulated platform.
Does Mashvisor offer discounts for nonprofits, startups, or education?
Mashvisor does not publicly advertise nonprofit, startup, or education discounts. However, they frequently run seasonal promotions and holiday sales (20-30% off annual plans). Check their website during Black Friday, Cyber Monday, or New Year for limited-time offers.
What is Mashvisor’s cancellation policy?
You can cancel anytime from your account settings. After cancellation, you retain access through the end of the paid period, but no refunds are issued after the trial period. If you cancel mid-year, you don’t get prorated refunds for unused months.
Can Mashvisor replace a dedicated STR management platform like Hospitable or Guesty?
No. Mashvisor is designed for acquisition research, not operational management. The Manage plans exist, but most users report buying Mashvisor for market analysis and then switching to Hospitable, Guesty, or Lodgify for channel management, guest messaging, and task automation once they own properties.
Is Mashvisor right for buy-and-hold investors who never rent properties?
No. Mashvisor is built for rental property investors (STR or LTR). If you’re buying properties for appreciation only (no rental income), Mashvisor’s rental analytics and cash flow projections won’t help. Stick with Zillow, Redfin, or MLS platforms for property search and valuations.
Final Verdict
Mashvisor solves a specific problem well: accelerating rental property research for investors in the acquisition phase. The side-by-side STR vs. LTR comparison is genuinely useful and not replicated by competitors. The heatmap interface saves time when screening neighborhoods across multiple markets. For out-of-state investors deciding between Austin, Phoenix, and Nashville, Mashvisor compresses weeks of research into hours.
But the platform has real limits. Data accuracy degrades in smaller markets, and multiple user reports flag inflated projections in rural or emerging areas. The annual billing structure (despite monthly pricing marketing) creates trust issues. Customer support inconsistencies and a strict no-refund policy amplify frustration when things go wrong.
Mashvisor is best for investors focused on major U.S. metros who are comparing rental strategies and need fast market screening. It’s weak for international investors, active property managers, and anyone operating in smaller markets with thin comp data. If you fall into the ideal use case, the Standard plan at $49.99/month (annual billing) is a reasonable investment. If you’re outside that profile, competitors like AirDNA, Airbtics, or free tools like BNBCalc may serve you better.
Last updated on May 2, 2026